NOTE: It is assumed you know how to create custom Dashboards and Charts, and have an understanding of chart Types, Presets, and Metrics. If not, read this article before proceeding.
When building your own Dashboard Charts, you can pull data from various data sources to view different types of analytics events.
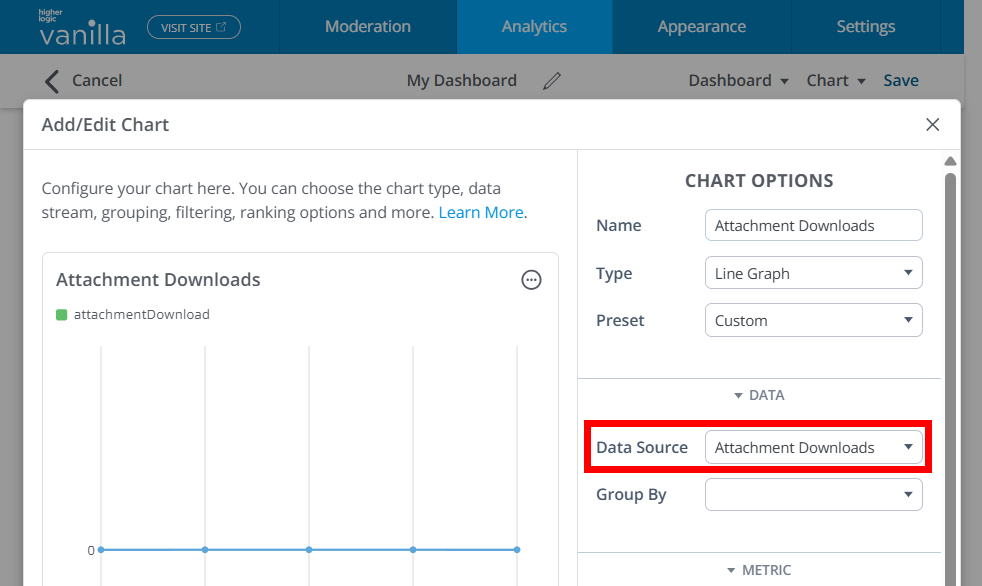
In this article, we're going to focus on the Attachment Downloads data source, which records each time a user downloads a file attachment from your Higher Logic Vanilla (Vanilla) community (e.g., from posts, comments, or knowledge base articles).
Overview
The Attachment Downloads data source provides metrics on how users are downloading attachments within your Vanilla community. Specifically, it tracks and makes available the following attachment data:
- Attachment type (such as PDF, image, PPTX, etc.)
- Attachment title (file name)
- Information about the downloader (username, role, etc.)
- Information about the uploader (username, role, etc.)
- Dates of upload and download
- Location in which the attachment is posted (category, subcommunity, knowledge base, and post)
Common use-cases
- Download trends over time: Track overall attachment download activity by day/week/month to understand content engagement patterns across your community.
- User engagement reporting: Identify who is downloading attachments most frequently and correlate with roles or segments using chart grouping and filters in the editor.
Filter Chart data
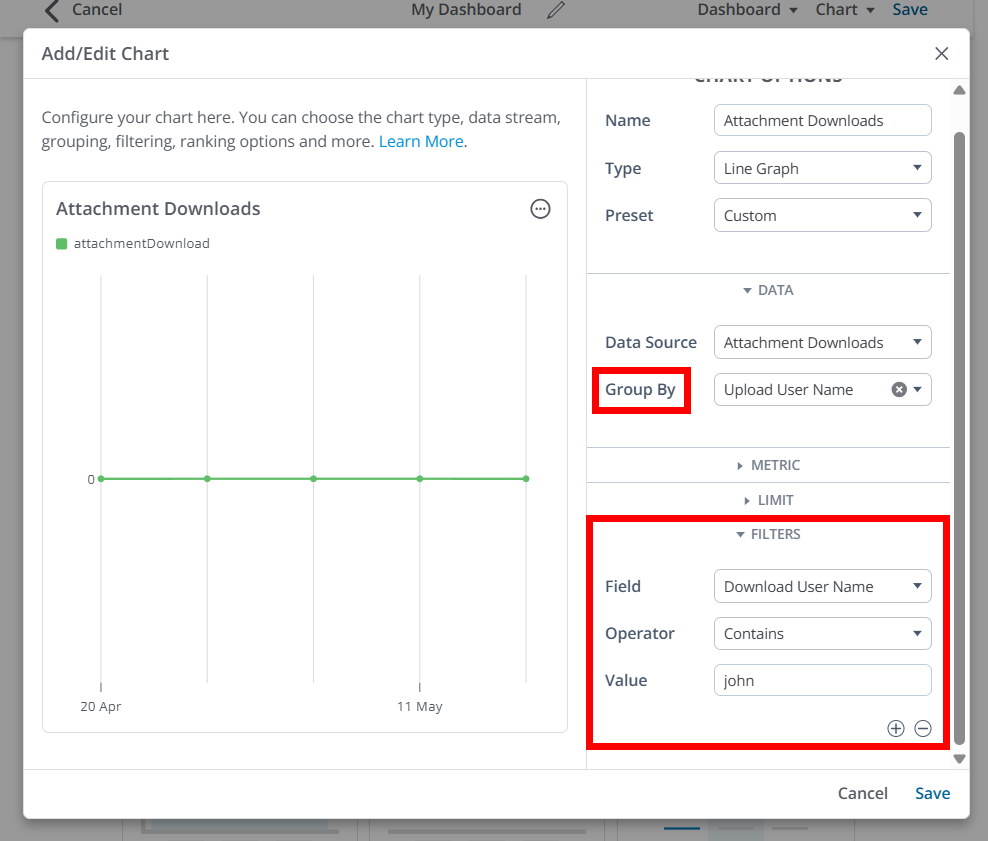
Controlling what data is shown in a Chart is accomplished via the Group By and Filter options.
- The Group By options (available for pie graphs, line graphs, bar graphs, and tables) enable you to view data by attachment type, Category, subcommunity, user name/ID, and more.
- You can add Filters to your query using these same options to drill into or exclude specific types of attachments, Categories, users, and more.
TIP: You can add one or multiple Group By and Filter options to dissect the data how you see fit. Generally speaking, you'll select Group By options to view a specific slice of data, and, if needed, use Filters to dig deeper.
Let's learn about each of the available Group By and Filter options.
NOTE: These options can be used both to group and filter data.
Attachment details
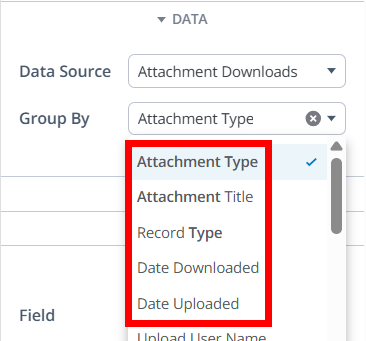
Use the following metrics to view details about the attachments:
- Attachment Type: Group or filter downloads based on the type of file (e.g., PDF, image, PPT). This metric enables you to see which file formats are most frequently downloaded in your community.
- Attachment Title: Group or filter downloads by the attachment's file name. This is useful for identifying the most popular individual documents or resources.
- Record Type: Indicates to what type of content the attachment is attached (e.g., a discussion, comment, etc.).
- Date Downloaded/Uploaded: Use these metrics to understand what files are being downloaded or uploaded within specific time periods. This can be helpful in situations where you want to monitor specific upload/download activity associated to specific events in your community, such as a recent event you hosted or product launch.
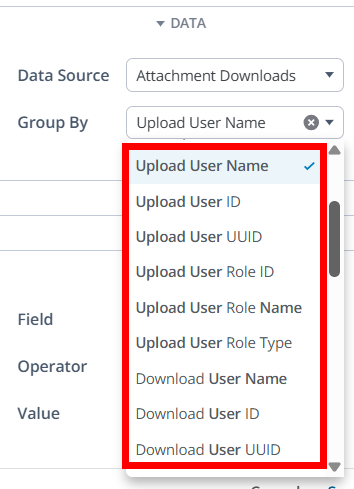
User details
Leverage these user-based metrics to group or filter attachments by attributes of the user who downloaded or uploaded them, including username and role (and other standard user details).
This allows for insights into which segments of your community are consuming which files—for instance, distinguishing between roles such as members, moderators, or admins.
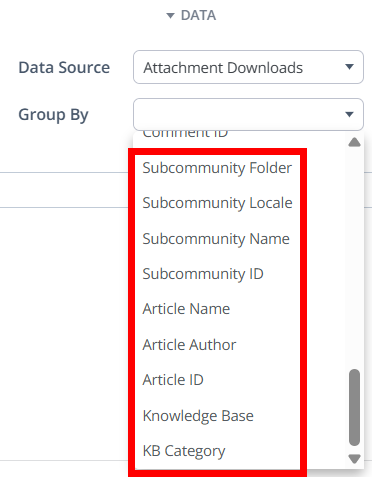
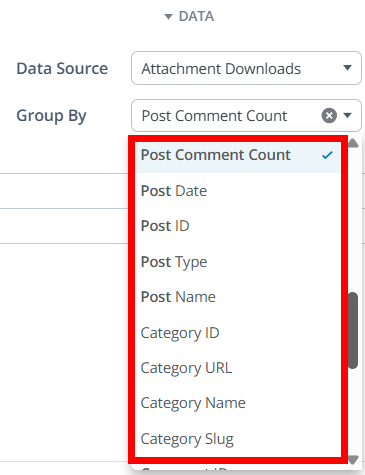
Attachment location details
Numerous options are available to help you understand download activity based on various locations across your Vanilla community: Category, Subcommunity, Knowledge Base, Post (discussions, questions, etc.).
Use these metrics to group or filter activity by the context in which the file was posted—such as the category or knowledge base article it was attached to, or the subcommunity or discussion it belongs to. This helps track which areas of your community drive the most download engagement.
Locations options continued: