NOTE: It is assumed you know how to create custom Dashboards and Charts, and have an understanding of chart Types, Presets, and Metrics. If not, read this article before proceeding.
When building your own Dashboard Charts, you can pull data from various data sources to view different types of analytics events.
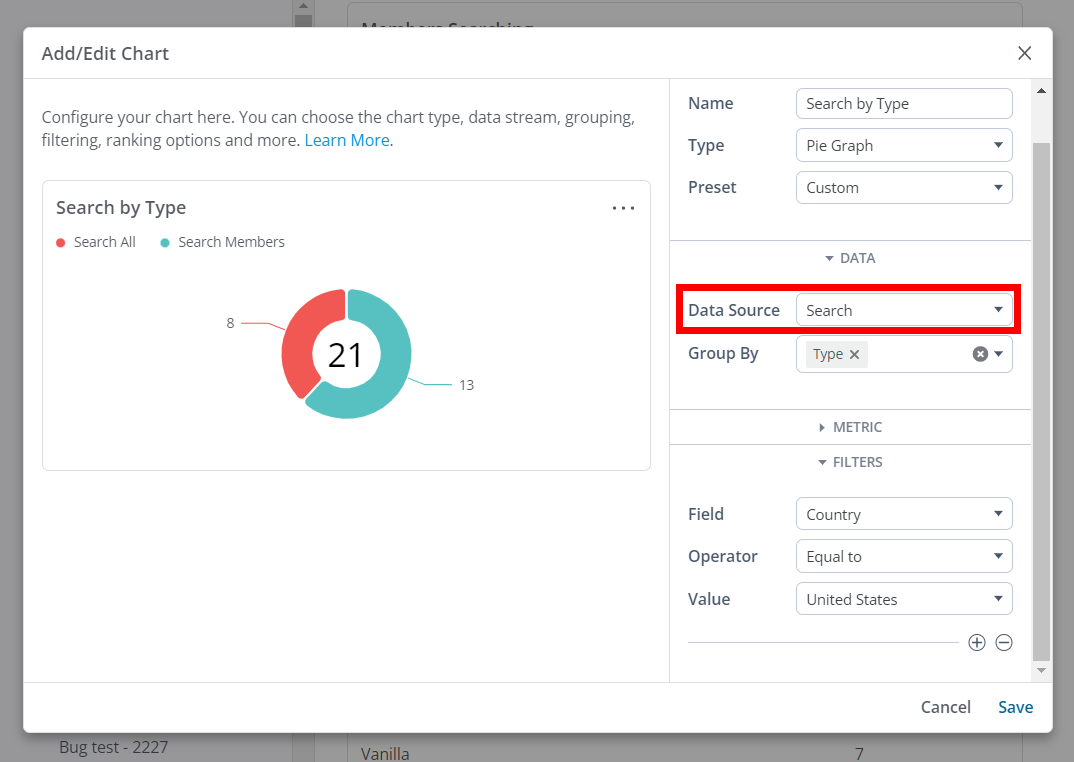
- In this article, we're going to focus on the Search data source, which tracks all search activity across your Higher Logic Vanilla (Vanilla) community.

Overview
The Search data source tracks all search activity across your community. For each Search event logged, you can see:
- Various search details
- Information about the user who searched
Refer to the Filter Chart data section below for more information each of these.
Filter Chart data
Controlling what data is shown in a Chart is accomplished via the Group By and Filter options.
- The Group By options (available for pie graphs, line graphs, bar graphs, and tables) enable you to view data by content type, search term, location, and more.
- You can add Filters to your query to drill into or exclude specific types of Search events (e.g., exclude specific user searches or focus your Chart on searches performed in a specific country or subcommunity).
TIP: You can add one or multiple Group By and Filter options to dissect the data how you see fit. Generally speaking, you'll select Group By options to view a specific slice of data, and, if needed, use Filters to dig deeper.

Let's learn about each of the available Group By and Filter options.
NOTE: These options can be used both to group and filter data.
Search details
You can use the following Group and/or filter options to refine chart data:
- Type or Domain - View what type of content is being searched for (e.g., discussions, articles, etc.).
- Search Terms - Shows ALL uses of a keyword, whether individual or in phrases.
- Original Query - Shows only keyword usage in "phrases."
NOTE: There is some nuance to how Search Terms and Original Query capture and present their data; refer to the Search Term vs Original Query section below to learn more.
- Search Results Count - See the number of results returned.
- Tag ID / Name - View the tags used to filter search.
📝 NOTE: Tags are available for posts only.
- Search Source Key / Search Source Label - View a breakdown of searches against each Federated Search connector that is configured.
- Subcommunity ID / Name - See which subcommunity was searched.
- Knowledge Base ID / Name - See which knowledge base was searched.
Search Term vs Original Query
To better explain how these two data options function, and differ from each other, let's look at an example:
- As you see below, both Search Term and Original Query are reporting on the keyword "lookup" but the numbers don't match. Why? Let's dig into why this seeming disparity occurred.

As stated previously, Search Term analytic results show ALL uses of a keyword (in this case, “lookup”), whether individual or in phrases. On the other hand, Original Query analytic results only show keyword usage in "phrases."
⭐️ EXAMPLE: If 15 users search "lookup" and 7 users search "api lookup" this explains why:
- Search Term shows 22 total (because it’s combining individual usage AND phrase usage)
- Original Query results in 7 total (just phrase usage).
Type
Each Search activity logged has a type. The type parameter defines the type of content.
- All
- Posts (discussions, questions, ideas, etc.)
- Articles
- Places
- Members

Use the Group By or Filter option to understand the types of content being searched in your community.

Search Source
The Search Source Key and Search Source Label pertain to the source of each Federated Search connector that has been configured for your community. These options allow you to track your federated searches.
NOTE: The Search Source Key never changes.

- For integrations built with our Custom API Connector, the Search Source Key is the ID you configured.
- The Zendesk Guide connector will always have the Zendesk Search Source Key.

User options
The Search data source tracks details about each user who performs a search. You can Group and/or filter chart data by:
- User Name
- User ID
- User UUID
- User Role Type
- User Role Names
- User Role IDs
- User Rank
- Continent
- Country
