You can capture data from a variety of activities in your Higher Logic Vanilla (Vanilla) community and use those data to build custom Analytics Charts. These data (called Data Sources) can be represented in one of a variety of chart types and then the results grouped and filtered to generate a chart that displays exactly the data you want.
TIP: Review the chart types and choose the one that you think is the best choice to represent your data.

Why use a chart?
"Raw" data can be confusing, unappealing, and difficult to "digest." Charts, however:
- are a great way to visually organize your community-activity data,
- present data in a way that is easier to understand, and
- promote simplified data analysis and data comparisons.
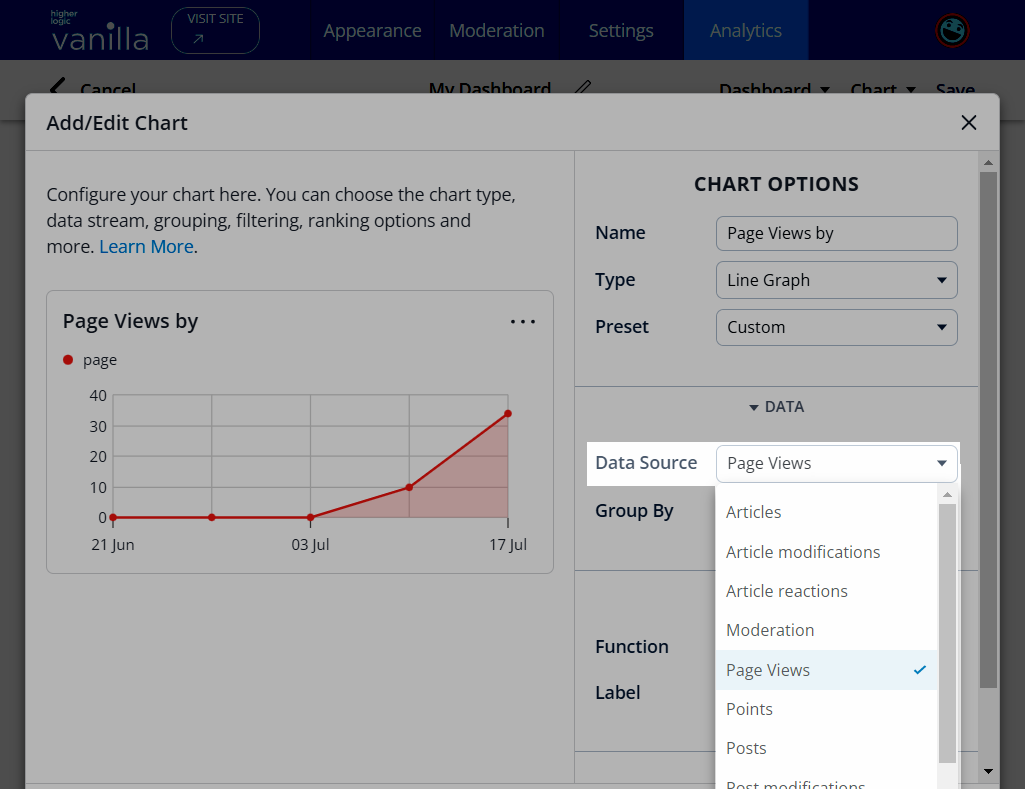
Data Sources for charts
This article describes the Data Sources that you can use to build charts to represent activity in your community. Each Data Source has grouping and filtering options so that you can construct charts that focus on exactly the data that you want to examine and report on. Data Sources and the grouping and filtering options are available from dropdown lists in the Chart editor (shown below).
NOTE: Some of the Data Sources and Chart options described in this article are available only if their associated addons are enabled in your Vanilla community. For example, the Vanilla Knowledge, Q&A, Ideation, Reactions, Badges, and Ranks addons are necessary for some of this reporting.
Articles
Article data is ideal for gathering high-level information about the Knowledge Base articles being added to your community. The query can be article-, user-, or date-based.
Check out the following article to learn about the Articles data source.
Article modifications
Article modification data focuses on any changes that have been made to your Knowledge Base articles. The query is similar to Articles but can be further grouped by Type and/or Locale.
Check out the following article to learn about the Article modifications data source.
Article reactions
Article reaction data is a great way to gather data on how users in your community are reacting to your Knowledge Base content via the "Was this Article Helpful?" prompt.
Check out the following article to learn about the Article reactions data source.
Badge
Badge data tracks when users receive Badges across your community.
Check out the following article to learn about the Badge data source.
Community Events
Community Events data tracks Event-related activity (such as new events and user registrations) across your community.
Check out the following article to learn about the Community Events data source.
Group
Group data tracks group-related activity (such as new groups and users joining/leaving groups) across your community.
Check out the following article to learn about the Group data source.
Moderation
Moderation data tracks all moderation activity across your community.
Check out the following article to learn about the Moderation data source.
Page Views
Page View data allows you to see how much traffic is visiting your community, including how many unique visits, sessions, and active (logged in) users there have been.
Check out the following article to learn about the Page Views data source.
Points
Use Point data to see how many reputation points have been awarded in your community through Badges, Reactions, and Q&A.
Check out the following article to learn about the Points data source.
Posts
Post data allows you to see how many new community posts were added to your community and how many users are contributing content. This includes new discussions, comments added, ideas posted, questions asked, and answers provided.
Check out the following article to learn about the Posts data source.
Post Modifications
Post Modifications data tracks all updates (i.e., modifications) to posts and comments across your community.
Check out the following article to learn how to chart changes (e.g., edits, moves, deletions) to member posts in your community.
QnA
QnA data tracks how many answers to questions have been marked as Accepted (i.e., Solved).
Check out the following article to learn about the QnA data source.
Reactions
Reaction data focuses on whether users are reacting to your content, how many users are reacting, and when reactions are being added.
Check out the following article to learn about the Reactions data source.
Registrations
Registration data tracks how many new users join your community. Use the options to get a look at who has joined your community and how.
Check out the following article to learn about the Registrations data source.
Search
Search data tracks search-related activities across your community. For example, you can retrieve data for searches by knowledge base, subcommunity, and/or search term.
Check out the following article to learn about the Search data source.