Cheers,
Kara
P.S. Forgot who said, but also loved the idea of a thread where we could share examples of the charts we've built out and how they help us!
Photo by Alex Gruber on Unsplash
Here you go!
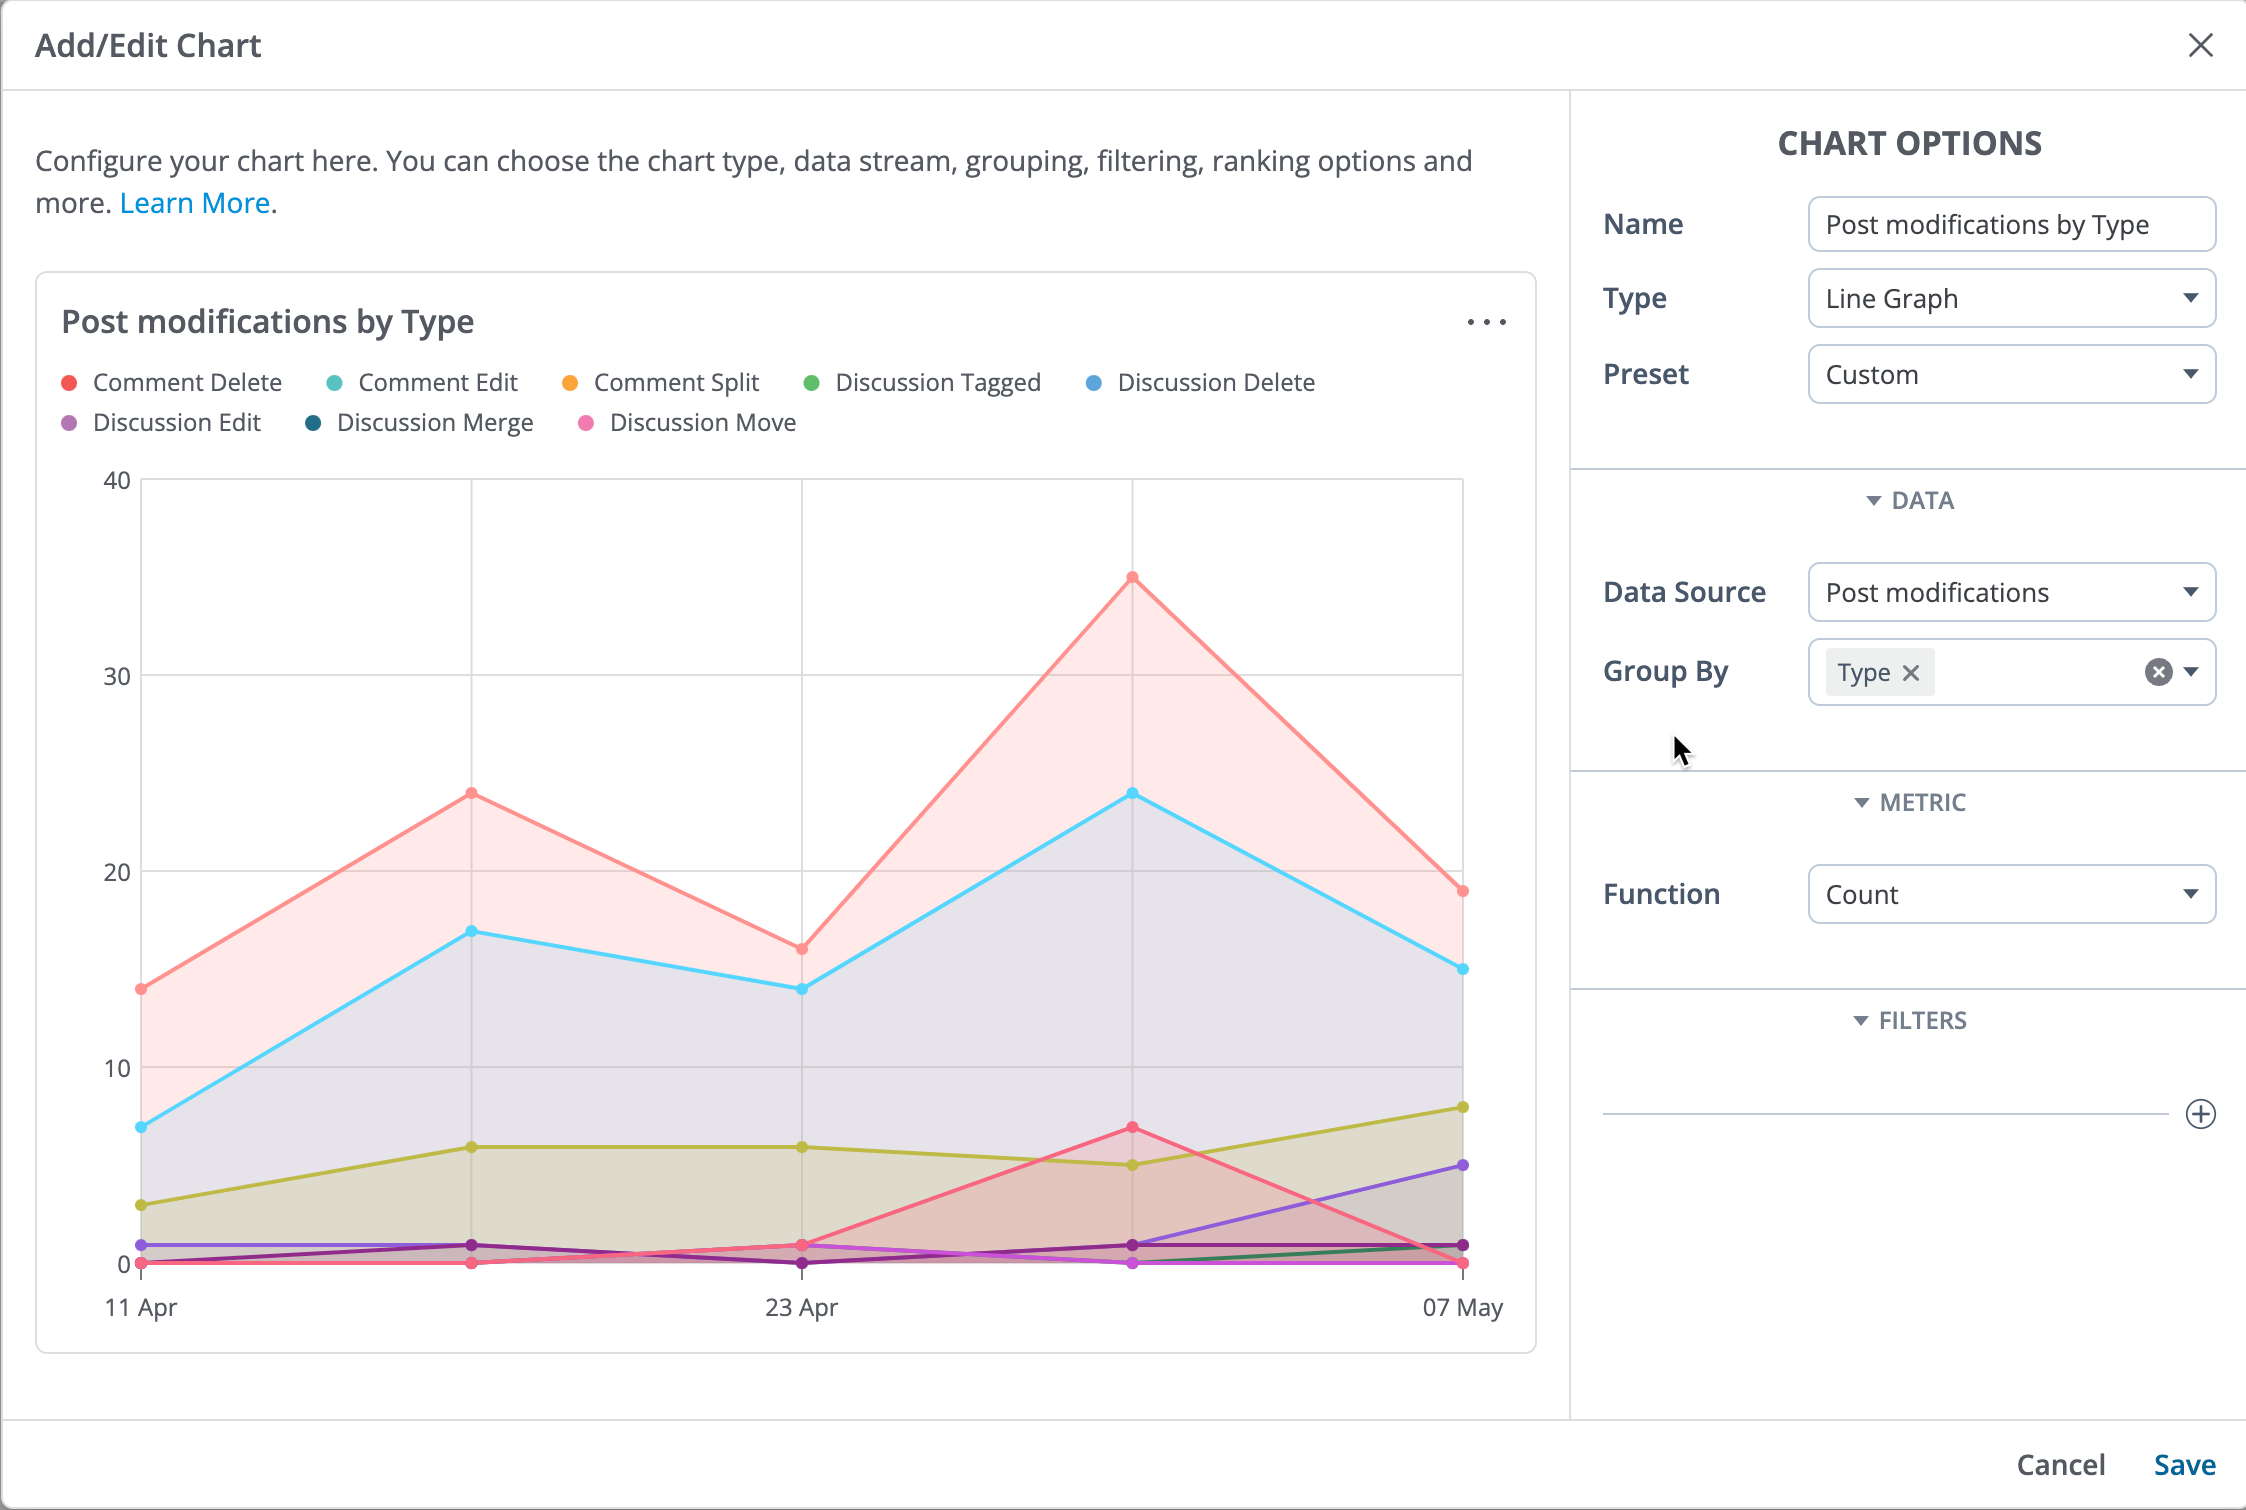
I've started playing with charts since this session!
I have a Summary pie chart and then underneath break it down per-day / week, etc.
My thought is to start reporting the number of actions Moderators take along side the number of posts to show a percentage of how many posts require some sort of action to be taken (other than Resolving).
I removed out Comment and Discussion delete as Merging deletes the previous post so the numbers were being duplicated. Looking forward to more updates in this area!
How I built the Spam one:
@Branwyn T Can we create a chart when a Discussion type of post is changed into a Question type of post? This is an event that our Moderators action all the time and I'd like to show how frequently it happens on a weekly basis. I don't see it as a "Type" under "Post Modifications". Is there a different Data Source for this…. Q&A perhaps?
Cheers, Genevieve
@Genevieve P Sorry that I'm just now seeing this!
It looks like you've had more time to play with the new moderation data source than I have!
From my testing today, I'm not sure that changing the post type gets recorded as moderation. I changed a few and tried to create a chart to reflect those action and came up blank.
Thanks for following up!
⭐️ Got something cool to share? Have a victory in your community and want to show off your accomplishments with fellow community builders? 🙋 Got questions? Bring your community, tactical and random questions and get answers from peers and Vanilla experts! 🗓 Join our very own @MichaelH and @HLNicole, and a group of your…
Join our AI Study Group for Community Managers. At each session we'll discuss what group members are experimenting with and learning, how we're using AI in our communities, and help one another problem solve. The group meets monthly, and is open to any community professionals interested in the topic of AI. Hosted by our…